What Is a Supply Chain KPI Dashboard and Why Is Yard Data Usually Missing From It?
Key Takeaways:
- A supply chain KPI dashboard should show where transportation cost, risk, and delay actually originate. Yard data is often the missing layer that explains detention exposure, trailer dwell, labor waste, and network performance gaps.
- Real-time yard KPIs expose detention risk, trailer dwell, dock congestion, overtime, and compliance gaps before they turn into invoice disputes or throughput delays.
- The best dashboards do more than report performance. They connect live yard data to operational decisions, helping teams prioritize moves, rebalance dock capacity, and act on exceptions faster.
- Purpose-built yard data improves KPI accuracy by capturing every gate transaction, move request, dock event, dwell milestone, and status change instead of relying on stale snapshots.
Your leadership meetings run on stale yard data while detention fees, trailer bloat, and overtime quietly bleed your P&L. You lack trailer dwell times by site, gate throughput metrics, and dock utilization records.
This data gap creates margin exposure you can't quantify until invoices arrive.
A supply chain KPI dashboard closes this gap. The dashboard turns your yard from an untracked cost center into a measurable source of network-wide savings.
What Is a Supply Chain KPI Dashboard?
A supply chain KPI dashboard is a consolidated view of the metrics that tell you whether your network is performing, bleeding cost, or creating compliance risk. Most dashboards pull data from WMS, TMS, and ERP systems.
This creates a structural gap — gate, yard, and dock operations are routinely absent from the picture.
The yard is the missing link between transportation and warehousing systems. When a trailer sits for 24 hours with no status update, your perfect order rate drops without a clear origin.
Gate queue backups extend your order cycle time, but the dashboard shows only the transportation delay. A missed safety inspection creates liability exposure that never surfaces in your compliance metrics.
Your dashboard tracks the symptoms while the yard holds the causes. Trailer dwell time, gate throughput by shift, and dock assignment delays remain invisible.
The metrics you're watching — fill rates, inventory turns, freight costs — reflect problems that started in the yard but show up everywhere else on your dashboard.
Why Operations Leaders and COOs Seek Real-Time KPI Visibility
Network-level decisions made on outdated, inconsistent data cause problems. They turn operations leaders into reactive firefighters.
The Financial Blind Spot
The yard bleeds money through detention and demurrage fees that compound while leadership operates on yesterday's data.
Trailers sitting past their free period generate charges of $30-$50 per hour. Demurrage at ports can hit $300 per day. Your leased trailer pool swells because nobody knows which units are actually productive versus which ones sit idle for days. Spotter overtime accumulates when drivers spend shifts hunting for assets instead of moving them.
These costs stay hidden because the yard lacks the data infrastructure to surface them before they hit your P&L.
The invoice reveals damage that happened weeks ago. You can't dispute charges without timestamped records. You can't optimize trailer utilization without knowing which units haven't moved. The yard becomes a cost center instead of a lever.
Inconsistent Site Reporting Breaks Network Decisions
When every facility reports yard performance differently, your network-level decisions get made on inconsistent data. One site counts dwell from gate arrival, another from dock assignment. Site A reports detention exposure monthly, Site B mentions it when fees hit.
You can't benchmark Detroit against Phoenix because they measure different metrics on different schedules. Systemic problems — like a carrier consistently missing delivery windows across multiple facilities — stay invisible until they compound into P&L damage that shows up in quarterly reviews as an unexplained variance.
Compliance Pressure
Compliance is a data-capture problem before it's a reporting problem. If the underlying transactions aren't logged automatically at the point of activity, manual records will have gaps that don't survive regulatory or customer scrutiny.
Purpose-built YMS platforms like YardView support WAIRE/Rule 2305 reporting by capturing and organizing yard activity data used for ISIR and AWR submissions. They can also integrate with systems like Thermo King to surface temperature and trailer data that supports FSMA-related operational tracking.
Every transaction is stored with timestamps. This supports audit defensibility.
The Most Useful Supply Chain KPIs to Track on Your Dashboard
The KPI inventory is comprehensive, but not every metric deserves equal dashboard space on day one. You'll want to start with the KPIs that drive immediate decisions and catch the most failure modes before they compound into P&L damage.
Perfect Order
Perfect order rate is your single best diagnostic for customer-facing operations. It measures the percentage of orders that meet every condition listed below — if even one fails, the order doesn't count as perfect. To qualify, an order must be:
- Delivered on time
- Complete (correct items, correct quantities)
- Undamaged
- Correctly documented (invoice, paperwork, labeling)
When the perfect order rate drops, you can see which specific failure mode caused it: late departure from your dock, damage during loading, or incorrect paperwork. Each failure type points to a different fix.
Fill Rate
Fill rate detail — measured at order, line, and unit level — reveals where in the fulfillment sequence breakdowns are occurring. Your line-level data shows exactly which SKU categories are creating shortfalls.
When you can see that three line items failed on a specific product family, you know whether to expedite a replenishment order or investigate dock scheduling gaps that delayed inbound processing.
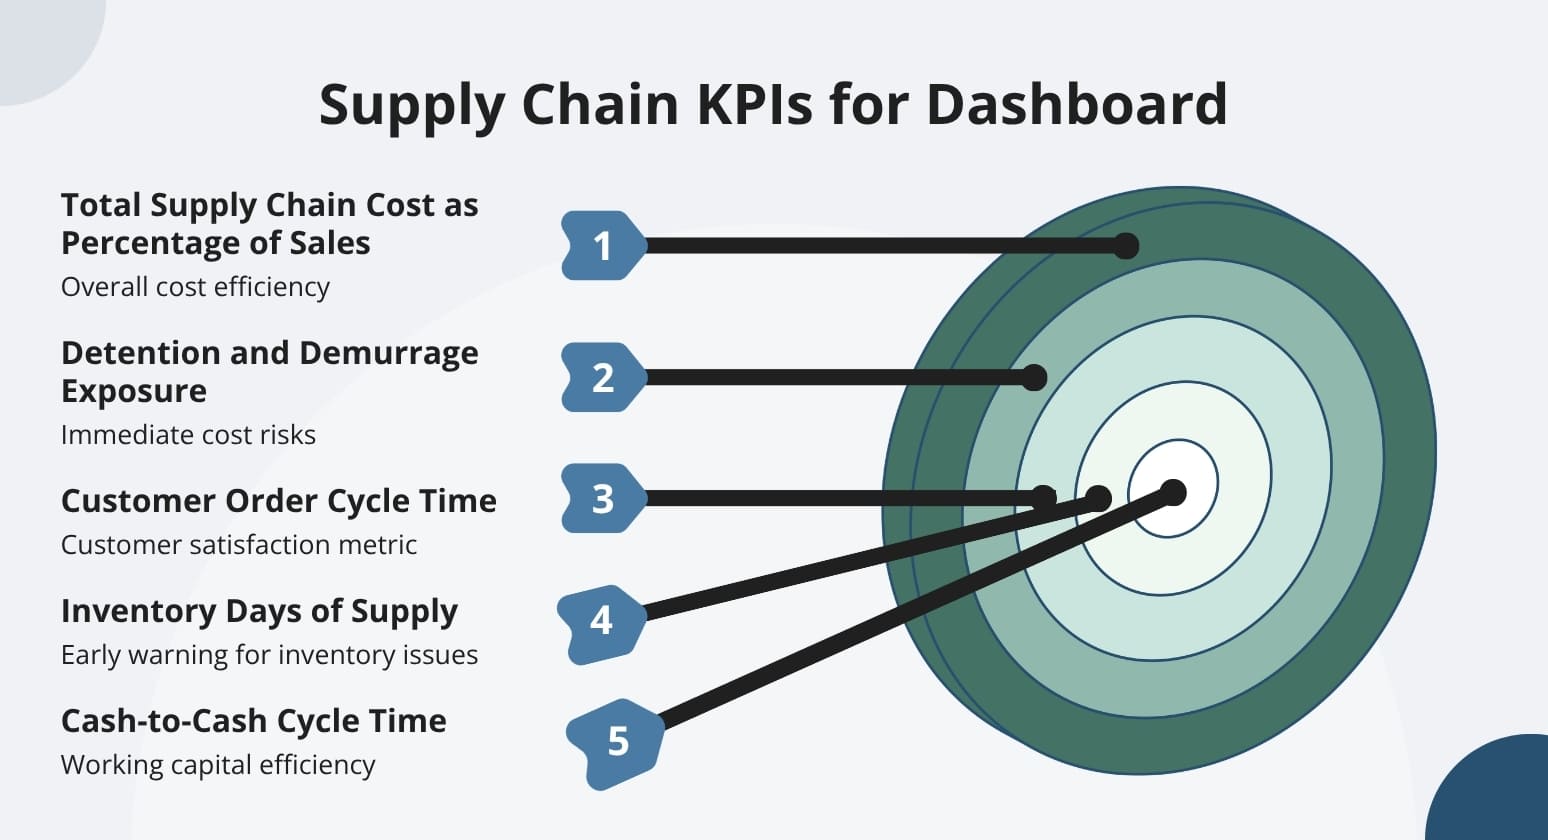
Cash-to-Cash Cycle Time
Cash-to-cash cycle time translates yard delays into working capital language. Finance immediately understands this.
Improved dock throughput compresses the cycle by days, not hours. Finance sees faster inventory turns and improved cash flow without needing to decode operational metrics.
Inventory Days of Supply
Inventory days of supply works as your early-warning system. When it trends upward without a matching sales decline, something in receiving or unloading is slowing product flow through your facility.
Track this metric daily at the facility level, weekly at the network level. When days of supply climbs, check trailer dwell first — product sitting an extra shift in a trailer before it moves to warehouse slots directly extends your inventory cycle.
Focus on reducing unloading delays and you'll see days of supply compress back to baseline.
Customer Order Cycle Time
Improvements here require coordination across three operational areas:
- Dock scheduling
- Yard throughput
- Carrier performance
When your dock delays extend cycle time, you can trace the delay back to trailer positioning or gate congestion. Your team can see which operational step is the bottleneck and address it before it compounds across the network.
Total Supply Chain Cost as Percentage of Sales
This metric connects operational performance directly to revenue and margin. When yard delays extend cash-to-cash cycle time, this percentage climbs. When D&D fees compound monthly, it shows up here.
The metric tells you whether operations contribute to margin or erode it.
Detention and Demurrage Exposure
D&D exposure isn't a monthly reporting metric; it requires live operational visibility. Teams need to see which containers crossed the free-time threshold today and which trailers are hours away from triggering detention charges.
That data supports quick decisions and helps teams intervene before avoidable fees accumulate.
Supply Chain Dashboard Types That Map to Operational Decisions
A dashboard's value is determined by whether it drives a decision, not by how many metrics it displays. The most common dashboard failure isn't too few metrics — it's metrics that don't map to anyone's actual job or enable specific operational choices.
Transportation and Logistics Dashboard
This dashboard tracks freight cost per lane, on-time delivery by carrier, accessorial charge trends, and transit time variability. Gate arrival timestamps and dwell data from your yard provide the documented evidence that validates or disputes carrier-reported performance figures.
When carriers claim delays aren't their fault, you have timestamped proof.
Yard, Gate, and Dock Operations Dashboard
A well-built yard operations dashboard delivers accurate asset positioning. It shows your entire facility in one live view.
You can see which trailer has been sitting since Tuesday without leaving your desk. Dock door dashboards mounted on the warehouse floor show real-time door occupancy and status to the people making unloading decisions.
When your dispatcher needs to assign the next dock, the dashboard shows which doors are open and which trailers are staged and ready. This digital visibility into physical yard status eliminates radio calls, reduces trailer search time, and gives your team the current state they need to prioritize moves and keep freight flowing.
Order Management Dashboard
This tracks fulfillment accuracy — perfect order rate, fill rate by line and unit, order cycle time, and exception volume. Yard delays surface here as customer-facing failures. When your dock congestion extends trailer search time, you'll see missed delivery windows before customers call.
Demand Planning Dashboard
This is the forward-looking complement to the inventory dashboard — tracking forecast accuracy, demand variability, and replenishment cycle adherence. Its usefulness depends on clean receiving data; when inbound trailer delays distort inventory arrival timing, demand planning inputs become unreliable.
When your receiving data shows skewed arrival patterns, replenishment orders get triggered two days early. Clean gate timestamps ensure your forecast variance percentages reflect actual demand, not yard bottlenecks.
Supplier Management Dashboard
Gate arrival and dock processing timestamps create documented records. This makes your supplier scorecards defensible during vendor performance reviews. The records are not anecdotal.
Supply Chain Risk and Compliance Dashboard
This tracks compliance completion rates. It tracks incident logs. It tracks emissions data. It tracks regulatory submission deadlines.
The dashboard only works if your underlying data capture is automated — manual compliance records create gaps that auditors will find. You'll see which submissions are overdue and which incident logs need completion before the review arrives.
End-to-End Network Dashboard for Multi-Site Visibility
A network-level dashboard shows performance across all sites. It finds outlier facilities, enables apples-to-apples benchmarking, and supports resource allocation decisions across the network. Single-facility views cannot provide these capabilities.
YardView gives you a live view across every facility — tracking carrier performance, cross-border shipments, out-of-service assets, and damaged equipment — all in one place.
YardView standardizes data capture at the transaction level — every gate event, dwell milestone, and dock assignment is logged the same way across every facility. That way, when network rollups compare Detroit against Phoenix, they're measuring identical data points on identical schedules.
You can see which sites are slow on dwell times, which carriers are missing commitments across multiple facilities, and where damaged assets are piling up network-wide.
Your team can reallocate resources based on actual performance data rather than anecdotes from the last leadership meeting.
Common Mistakes When Building a Supply Chain KPI Dashboard
Most dashboard failures are caused by metrics that don't connect to anyone's actual job. The mistakes below reveal whether your dashboard drives decisions or just displays data.
Tracking Vanity Metrics Instead of P&L Drivers
Vanity metrics fill dashboards with numbers that impress executives but don't drive decisions. Your trailer count might hit 500 units, but without dwell analysis, you can't identify which trailers are bleeding D&D fees.
Gate activity volume looks busy at 200 daily moves, but throughput efficiency reveals half those moves are repositioning assets that were mis-spotted initially.
It's important to focus on P&L-linked KPIs instead. D&D exposure shows exactly which containers approach free-time expiry, enabling dispatchers to prioritize moves before fees trigger. Cash-to-cash cycle time connects yard delays to working capital impact.
Total supply chain cost as percentage of sales forces every operational improvement into margin terms.
The difference is simple: vanity metrics measure activity, P&L drivers measure outcomes that affect your bottom line.
Ignoring the Yard as a Data Source
Many supply chain dashboards still underrepresent gate, yard, and dock operations. This may create a structural gap in your supply chain. This gap would then prevent accurate diagnosis of cost and throughput problems.
Without timestamped records, it is harder to dispute charges, verify D&D fees, or complete accurate audits. Fees can build up without dwell data to confirm what happened, and audit findings are harder to explain without a clear transaction history.
Good yard data helps teams confirm idle time, trace what happened, and support compliance checks. The yard produces the records that back up carrier invoices and detention claims, but many dashboards do not include it.
Building on "Free" WMS/TMS Yard Modules That Lack Real-Time Operational Data
"Free" yard modules bundled with WMS and TMS systems may lead to longer dwell times, manual workarounds, and higher detention costs — the real cost shows up in the invoice, not the license.
These modules can track which trailer is in which slot, but they stop there. A dedicated YMS goes further. It directs drivers to the right trailer, flags containers before detention fees kick in, and keeps dock teams and drivers connected without radio calls.
YardView has refined these capabilities across 28 years of optimizing real yard operations.
When your spotter can't see which trailer has been sitting idle for 36 hours, manual workarounds fill the gap. A dedicated YMS like YardView removes the need for radio calls and spreadsheet tracking that “free” modules often rely on.
Trusting Snapshot Data Instead of Full Transaction History
Snapshot data shows you where things are. It doesn't show you how they got there. When your detention KPI spikes, you can't trace which transaction caused the variance or when the status changed.
Your dispute with the carrier stalls because you have no record of the gate event timing. YardView stores every transaction with a full audit trail — not snapshots — so your KPIs can actually explain variance and defend disputed charges when the invoice arrives.
Over-Engineering With Unproven AI Before Proving Out Rule-Based Automation
The most common dashboard over-engineering mistake isn't dashboard design. It's replacing proven rule-based operational logic with AI-first systems that require months of tuning.
These test approaches produce unpredictable outputs. Start with YMS partners that have a proven track record before moving to newer, more experimental technology.
Transform Yard Data Into Network-Wide Financial Intelligence With YardView
YardView's purpose-built yard management platform addresses the data gap that leaves D&D fees, trailer dwell, and labor costs invisible on supply chain KPI dashboards.
- Detention and Demurrage module with real-time dwell tracking, configurable fee rules, and alerts that flag trailers approaching free-time expiry before fees trigger — giving dispatchers time to act
- Drag-and-drop yard console displaying up to 16 data points per asset across all docks, spots, lanes, and zones in a single live view
- Automated timestamped transaction logging of every gate, yard, and dock event — creating the documented proof that makes carrier invoice disputes defensible and regulatory audits survivable
- Enterprise-wide network views with multi-facility rollups, facility-level benchmarking, and automated scheduled reporting that saves teams up to 8 hours per week per key resource
- Comprehensive activity tracking and reporting for WAIRE compliance requirements — eliminating the manual data assembly step
Discover how YardView's 28 years of operational expertise work. Battle-tested reporting and analytics turn the yard around. They change it from a financial blind spot. They make it a measurable source of margin improvement.
FAQs
What Is a Supply Chain KPI Dashboard?
A supply chain KPI dashboard consolidates the metrics that tell you whether your network is performing, bleeding cost, or creating compliance risk. Most dashboards pull from WMS, TMS, and ERP systems, which means gate, yard, and dock operations are often absent.
The yard becomes the missing link where D&D exposure, trailer dwell, and dock throughput originate but don't surface until they appear as unexplained variances or month-end invoice surprises.
How Often Should Supply Chain KPIs Be Reviewed — And by Whom?
D&D exposure and dwell time need live feeds — fees compound while you're in meetings. Perfect order rate and cash-to-cash cycle time work as weekly or monthly leadership metrics.
Inventory days of supply falls between — daily at the facility level, weekly for network decisions. Don't force one cadence on all KPIs or treat monthly summaries as sufficient for hourly costs.
How Does a Dedicated YMS Improve KPI Accuracy Compared to a WMS or TMS Yard Module?
WMS and TMS yard modules provide basic slot tracking but miss the operational layer where KPIs originate. They don't capture real-time driver tasking data, post-arrival dwell records, or D&D management timestamps.
When dwell data is missing, your detention disputes go undefended. When task completion isn't logged, spotter productivity becomes guesswork. A purpose-built YMS stores every transaction, so your KPIs can actually support a charge dispute.