10 Yard Visibility Metrics for Real-Time Yard Management
Key Takeaways
- Logistics teams walking yards four times daily with clipboards can't prevent demurrage or OTIF failures because by the time manual audits discover a trailer sitting for 20 hours, opportunities for intervention have already passed.
- Gate processing time and trailer turnaround are the first metrics carriers use to determine "shipper of choice" status.
- Time-to-locate captures operational chaos consuming enormous labor hours as dock-ready facilities wait while spotters drive yards searching for trailers, with 80% of facility calls asking "where is it?" requiring physical searches that create cascading delays.
- Demurrage exposure and OTIF risk indicators transform reactive invoice payment into proactive intervention.
Picture this: logistics teams walking the yard four times daily with clipboards, manually counting trailers and noting positions, while transportation teams field constant calls from carriers asking where their equipment is.
By the time anyone realizes a trailer has been sitting for 20 hours, the demurrage clock has already started ticking. This reactive approach stems from a fundamental measurement gap—you can't improve what you can't measure, and you can't measure what you can't see.
Real-time yard visibility transforms guesswork into actionable data, giving Directors of Logistics and Transportation the metrics they need to prevent problems instead of explaining them after the fact. Here are 10 yard visibility metrics every enterprise yard operation should be tracking.
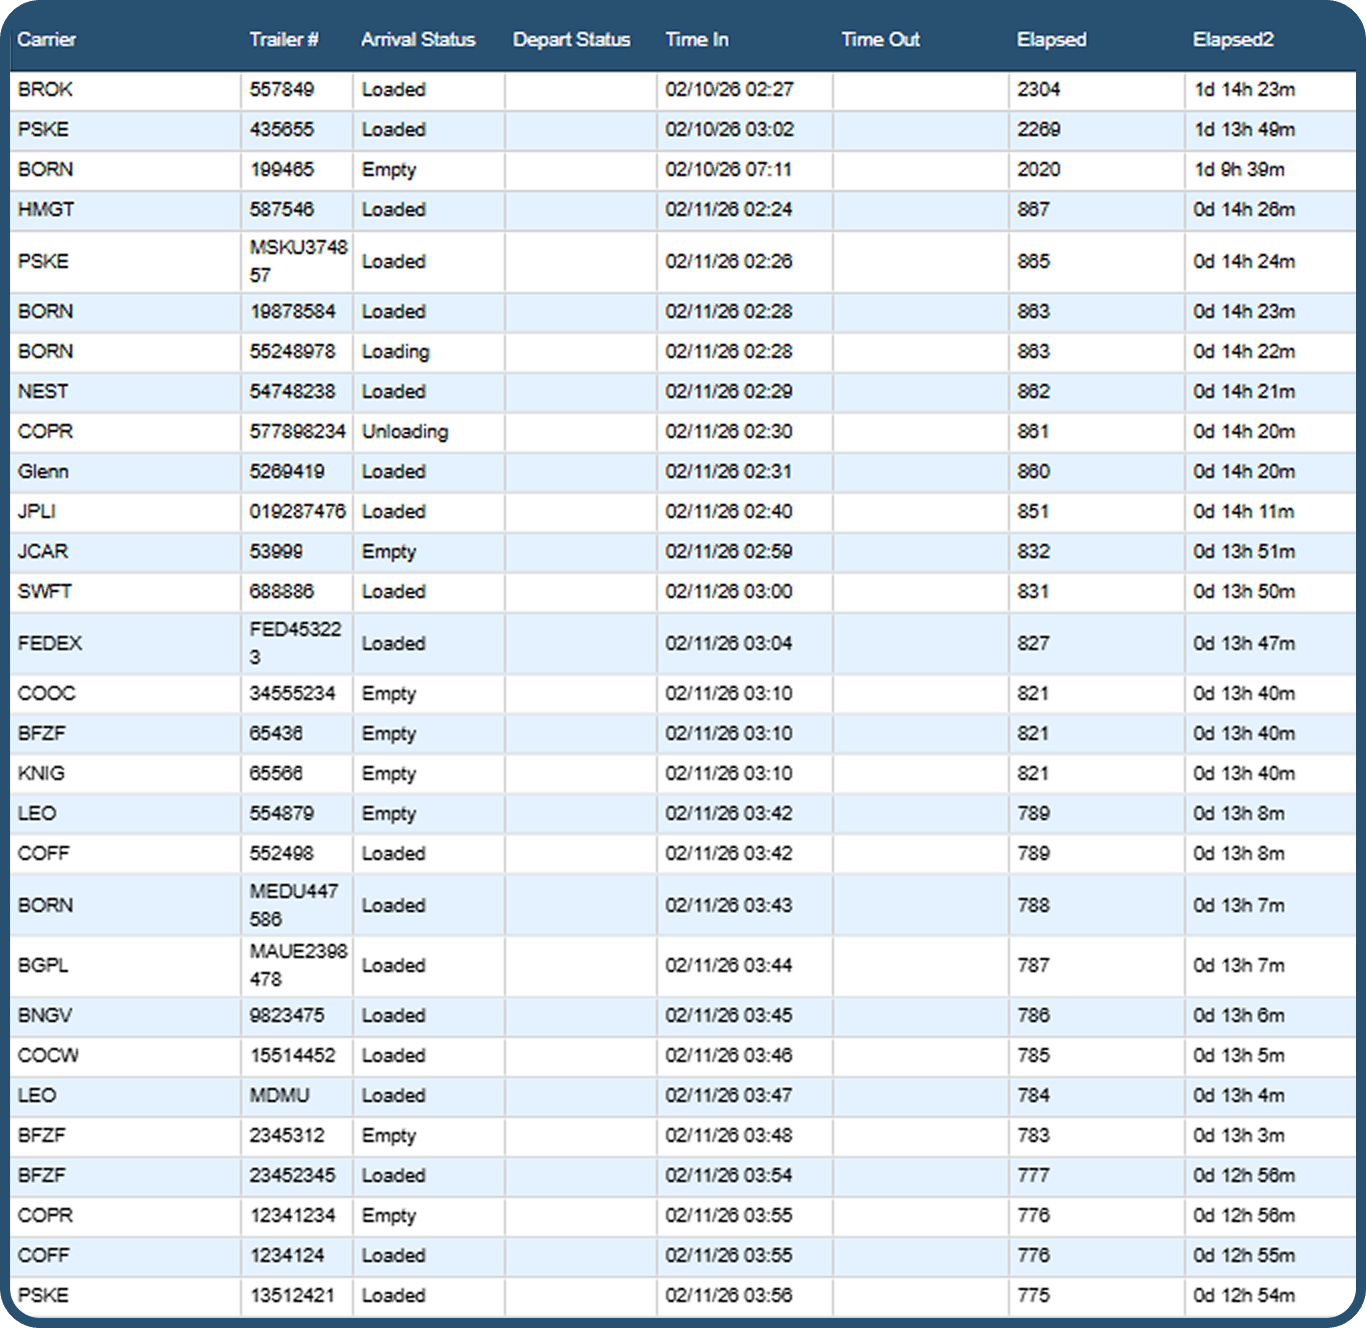
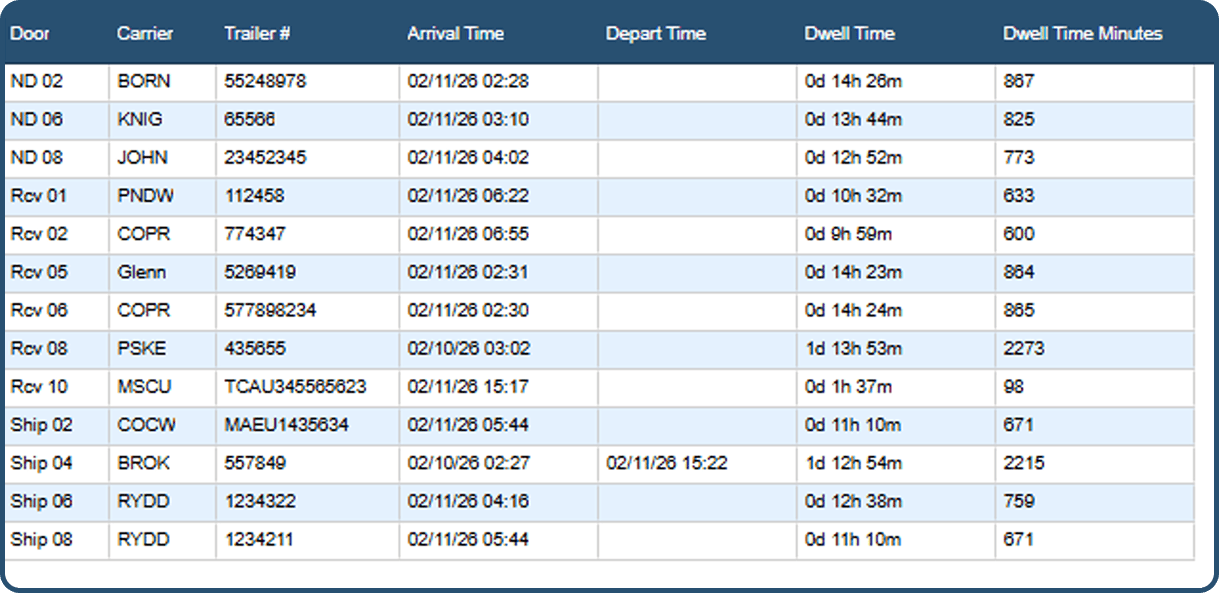
Yard Visibility Metric #1: Trailer Dwell Time
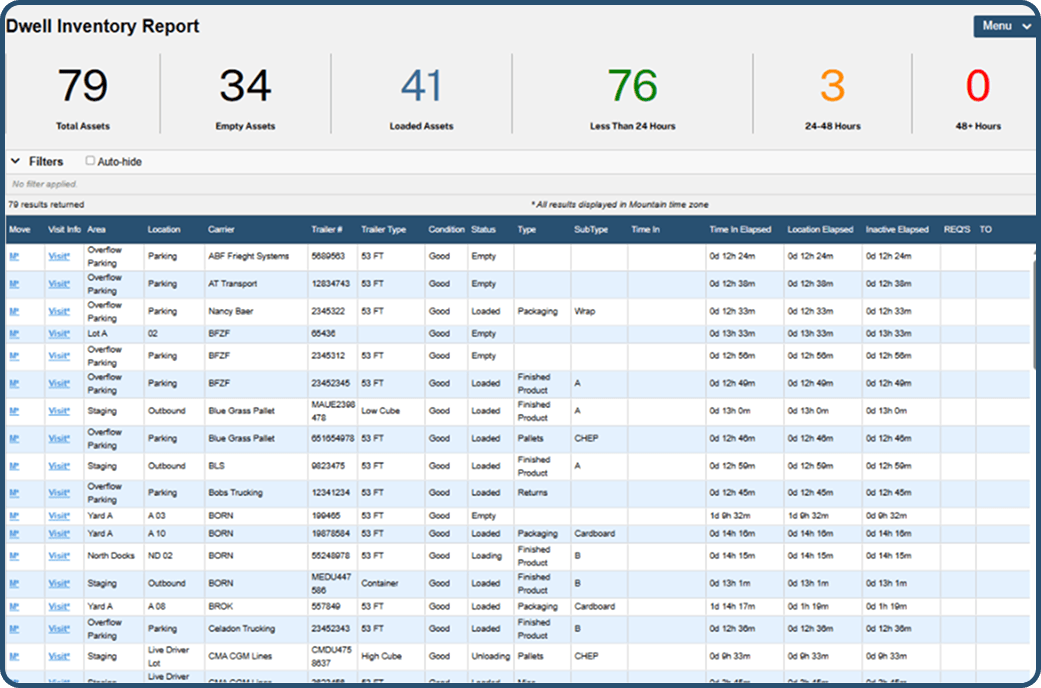
Trailer dwell time measures how long trailers remain idle in your yard before being loaded, unloaded, or moved. Every hour of dwell time consumes precious free time, yet without real-time visibility, demurrage charges accumulate silently until discovered during the next manual audit—often too late for intervention.
While the basic calculation divides total idle time by trailer count, the real value lies in tracking individual trailer dwell in real-time. Manual systems fail because by the time staff physically locate a trailer and determine how long it's been sitting, opportunities for action have already passed.
Effective dwell time management requires live visibility into every trailer's status with automated alerts when thresholds are reached—approaching demurrage limits, blocking critical dock access, or exceeding expected turnaround windows. Long dwell times don't just trigger charges; they create yard congestion that slows all other operations.
Yard Visibility Metric #2: Gate Processing Time
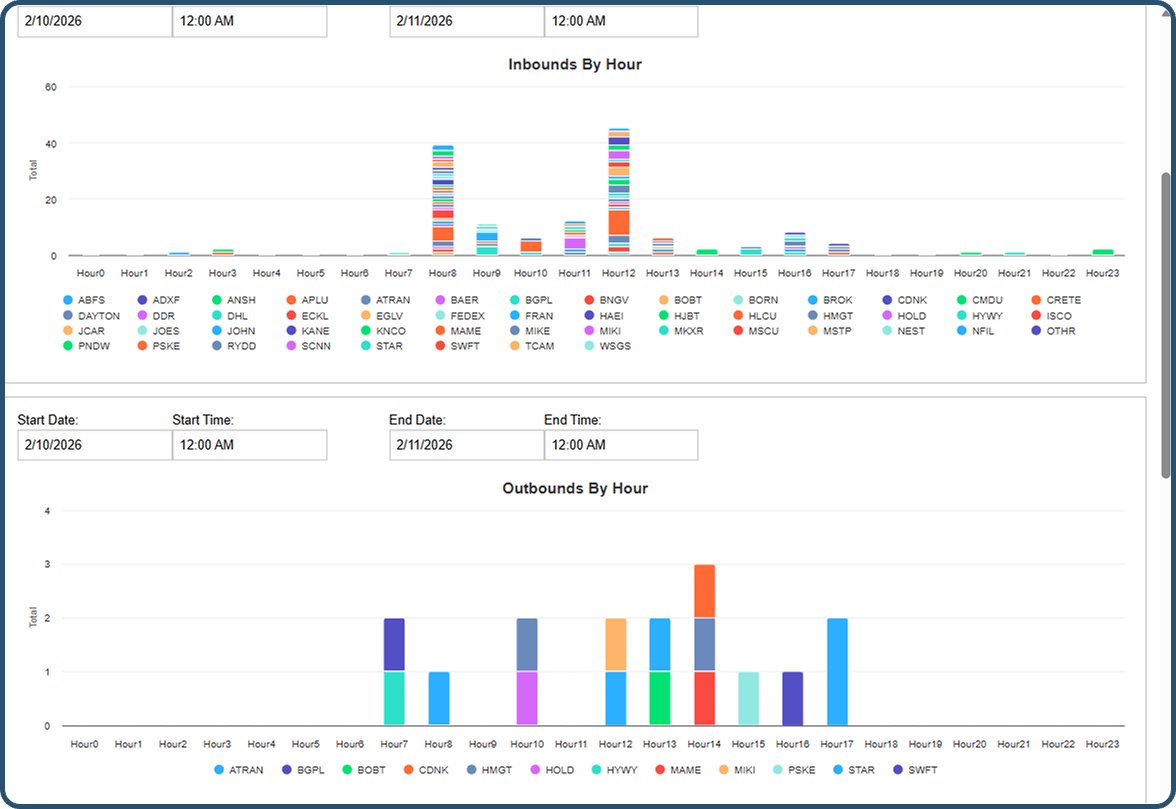
Gate processing time measures the duration from when a truck arrives at the facility entrance to when it's cleared and directed to its destination—dock, parking, or yard location. Long gate delays are the first thing drivers experience at your facility, and consistent delays spread through carrier networks, damaging your "shipper of choice" status.
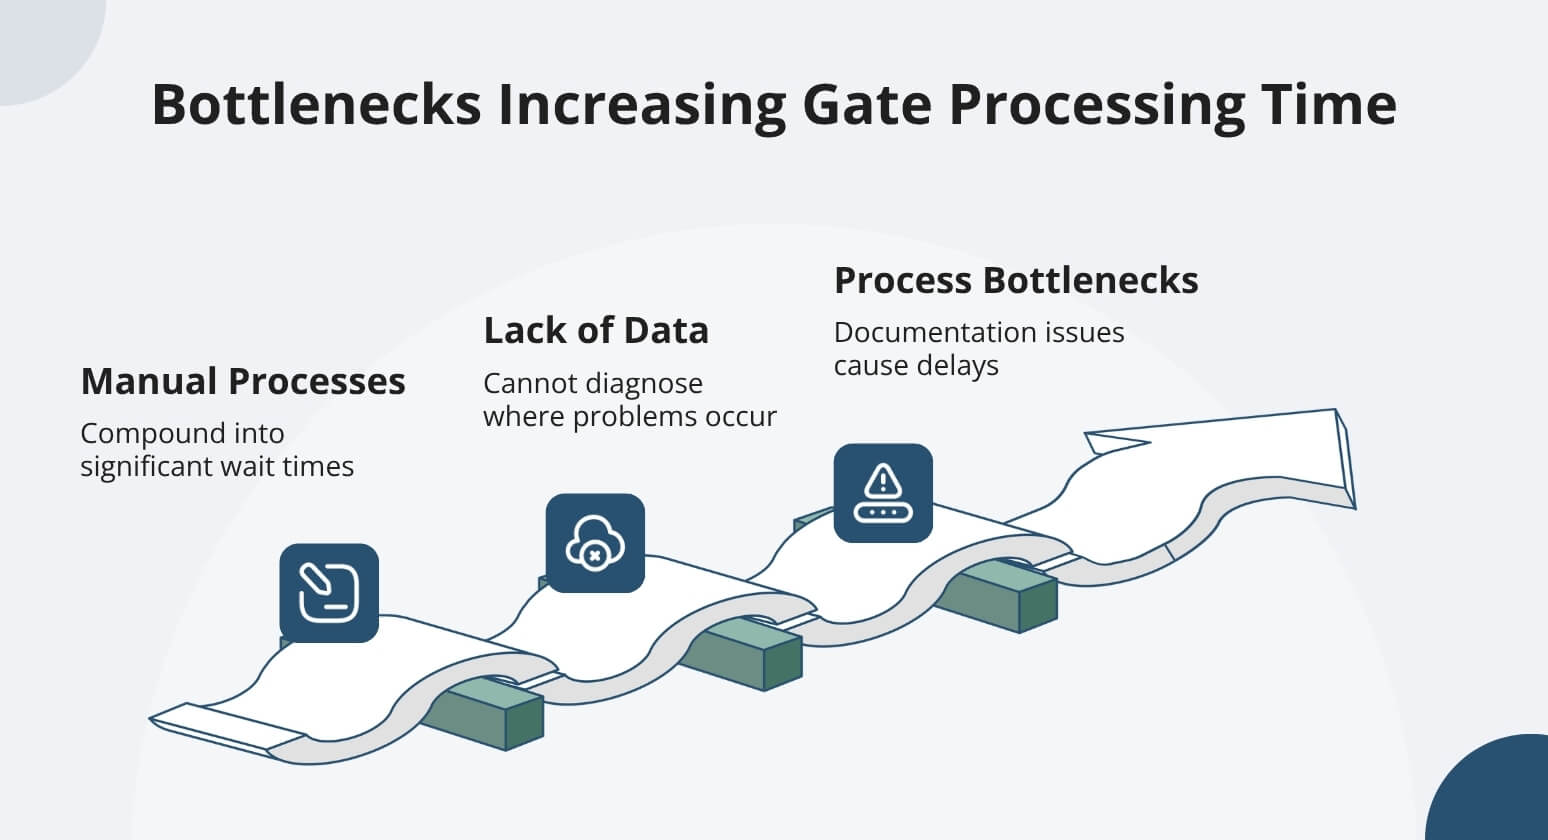
This metric encompasses check-in paperwork, safety verification, load documentation review, and system entry—manual processes that compound into significant wait times. Directors of Transportation hear carrier complaints about gate delays but rarely have data on actual processing times across facilities or shifts to diagnose where problems occur.
Directors of Logistics may staff gates adequately but lack visibility into whether processes are the bottleneck or if documentation issues from transportation are causing delays. Pre-arrival check-in capabilities eliminate most gate processing time by moving paperwork and verification online before the truck arrives, reducing gate interaction to simple identity confirmation.
Faster gate processing preserves the delivery window buffer time that protects OTIF performance.
Yard Visibility Metric #3: Dock Utilization Rate
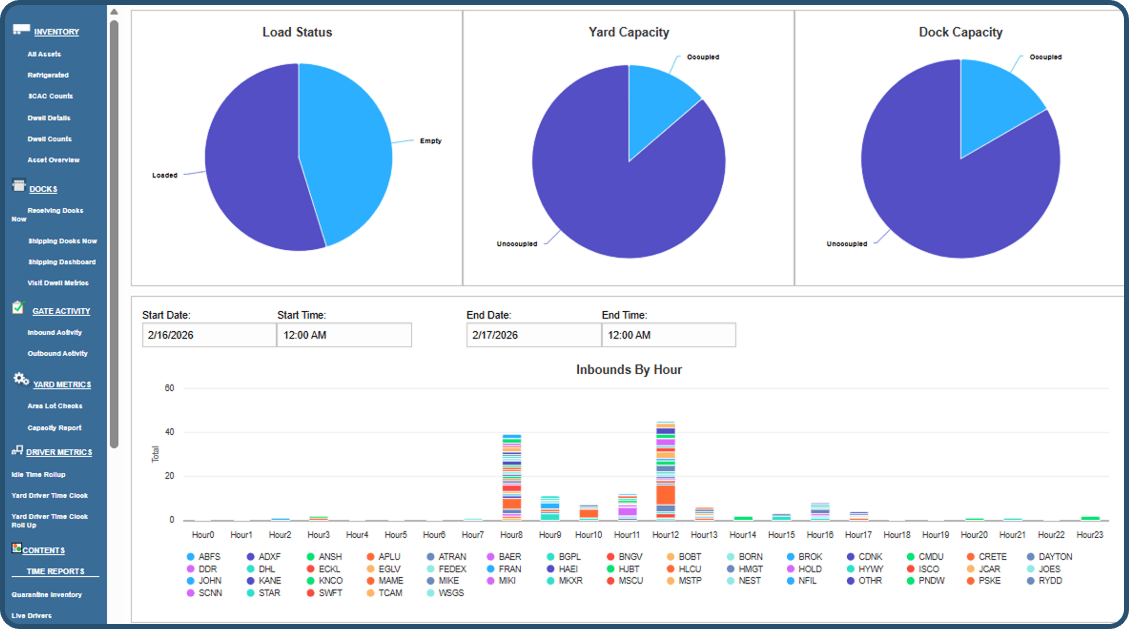
Dock utilization rate measures the percentage of time dock doors are actively loading or unloading versus sitting idle—calculated as active dock time divided by total available dock time across all doors.
Docks represent expensive infrastructure that directly limits facility throughput, yet most operations can't track actual utilization because it requires continuous observation beyond static schedules. Low utilization signals scheduling inefficiencies or trailer flow problems, while consistently maxed utilization indicates capacity constraints that cause OTIF failures during volume spikes.
The gap between scheduled and actual utilization widens when carriers arrive early or late, turning planned dock time into wasted time. Dynamic dock assignment based on real-time yard status optimizes throughput without adding doors.
Yard Visibility Metric #4: Trailer Turnaround Time
Trailer turnaround time measures the total duration from facility entry to exit, encompassing gate processing, yard dwell, dock time, and departure clearance.
This comprehensive metric captures the complete facility experience from a carrier's perspective—and carriers use these turnaround times to determine which facilities receive priority for capacity allocation. Longer turnarounds mean fewer loads per driver per day, directly impacting carrier profitability.
The measurement challenge is significant: tracking turnaround requires capturing accurate entry and exit timestamps, which manual systems frequently miss when drivers leave without checking out, or gate staff don't record exact times.
Directors of Transportation negotiate with carriers based on promised turnaround times but can't verify actual performance without data, making it impossible to identify whether improvements in individual areas actually translate to better overall performance or simply shift bottlenecks elsewhere in the operation.
Yard Visibility Metric #5: Yard Capacity Utilization
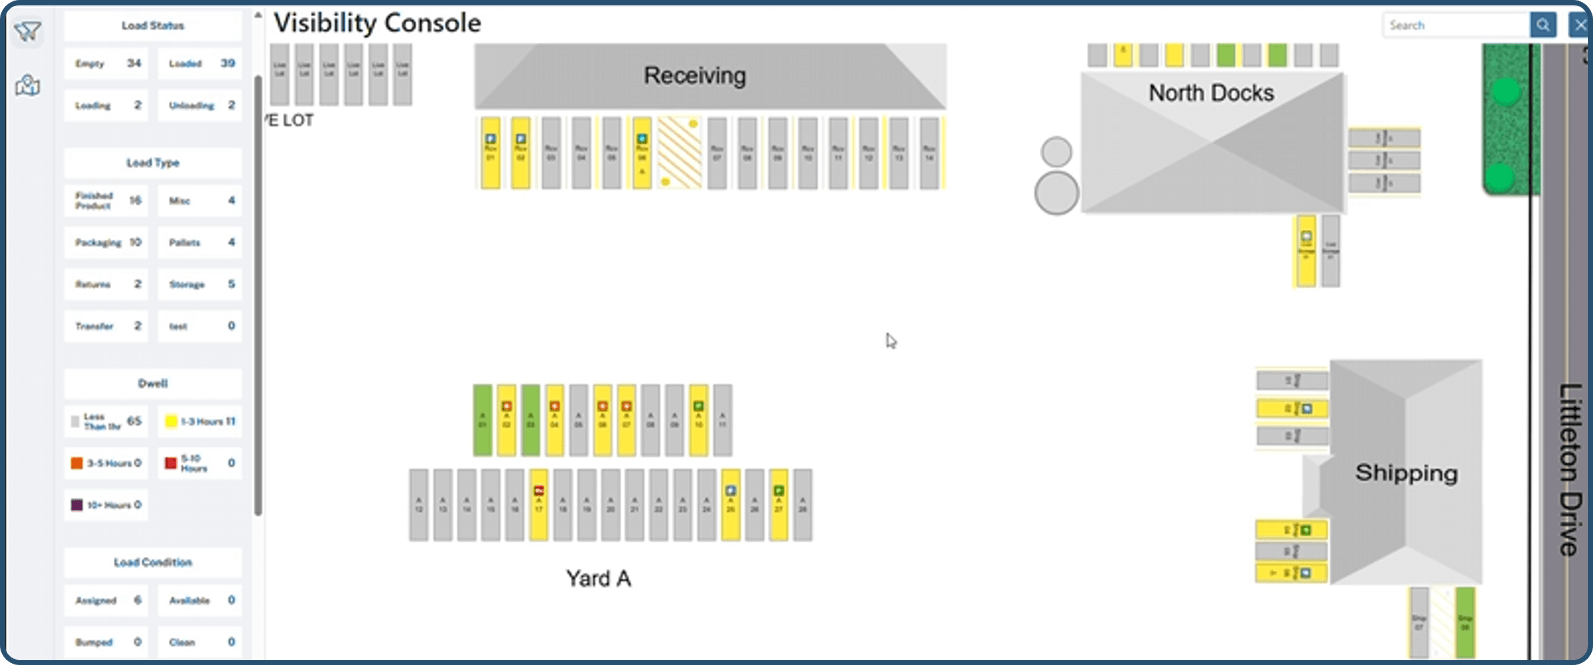
Yard capacity utilization measures the percentage of available parking spaces occupied at any given time. This metric presents a goldilocks problem: too low utilization wastes real estate and infrastructure investment, while too high utilization creates congestion that slows operations and creates safety hazards.
Manual tracking fails because yard capacity changes constantly as trailers arrive, depart, and move between locations—periodic audits provide misleading snapshots that miss peak congestion periods.
Optimal utilization isn't 100%; you need buffer capacity for operational flexibility and to prevent gridlock. Real-time capacity monitoring enables proactive decisions: when nearing limits, delay non-urgent inbound appointments or expedite outbound departures to maintain flow. Directors managing multiple facilities need aggregated capacity visibility to balance load across sites.
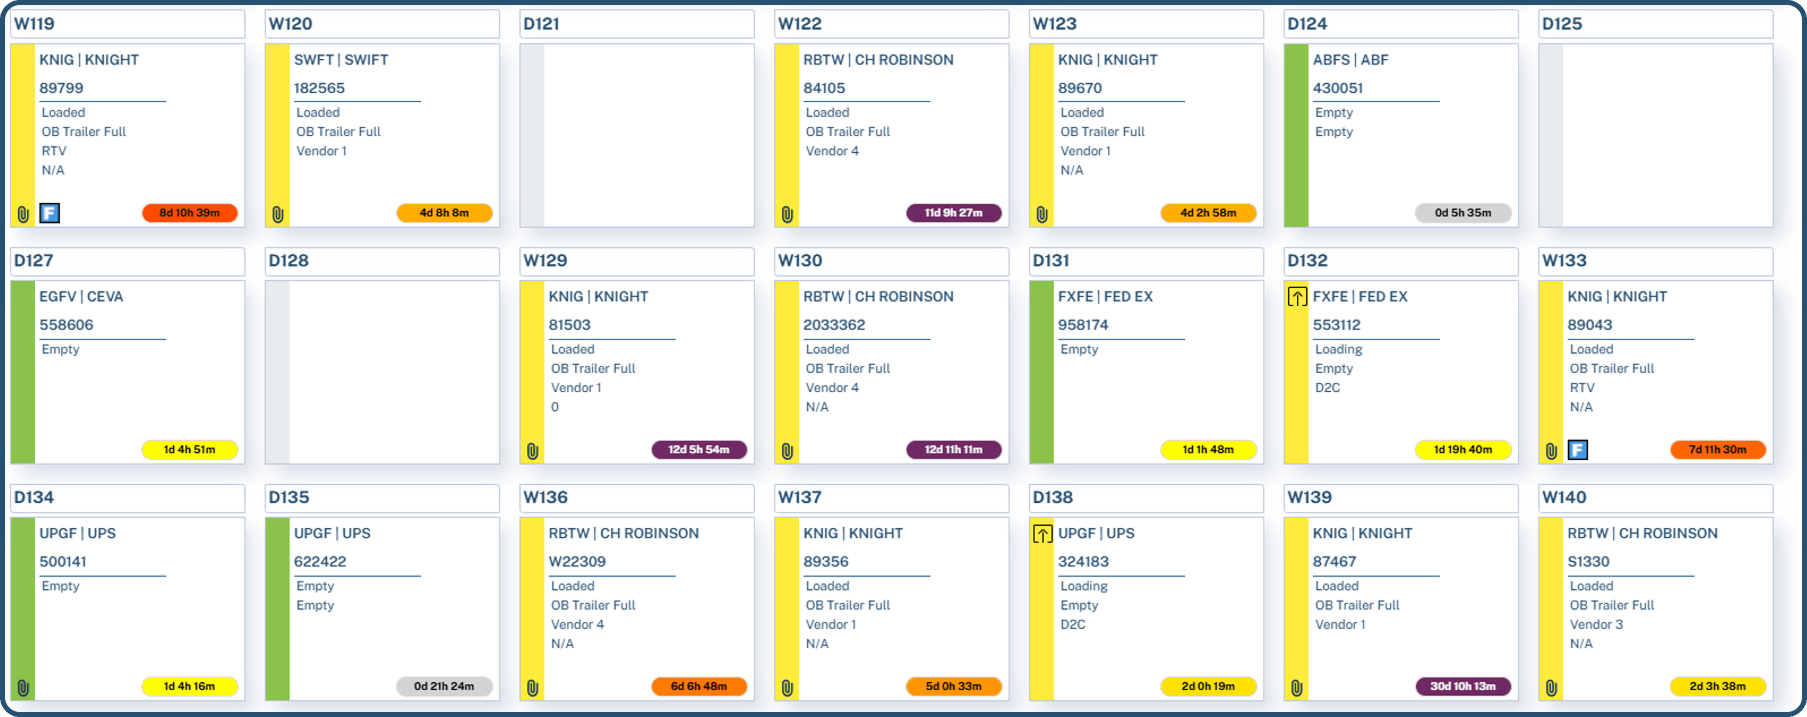
Yard Visibility Metric #6: Time-to-Locate
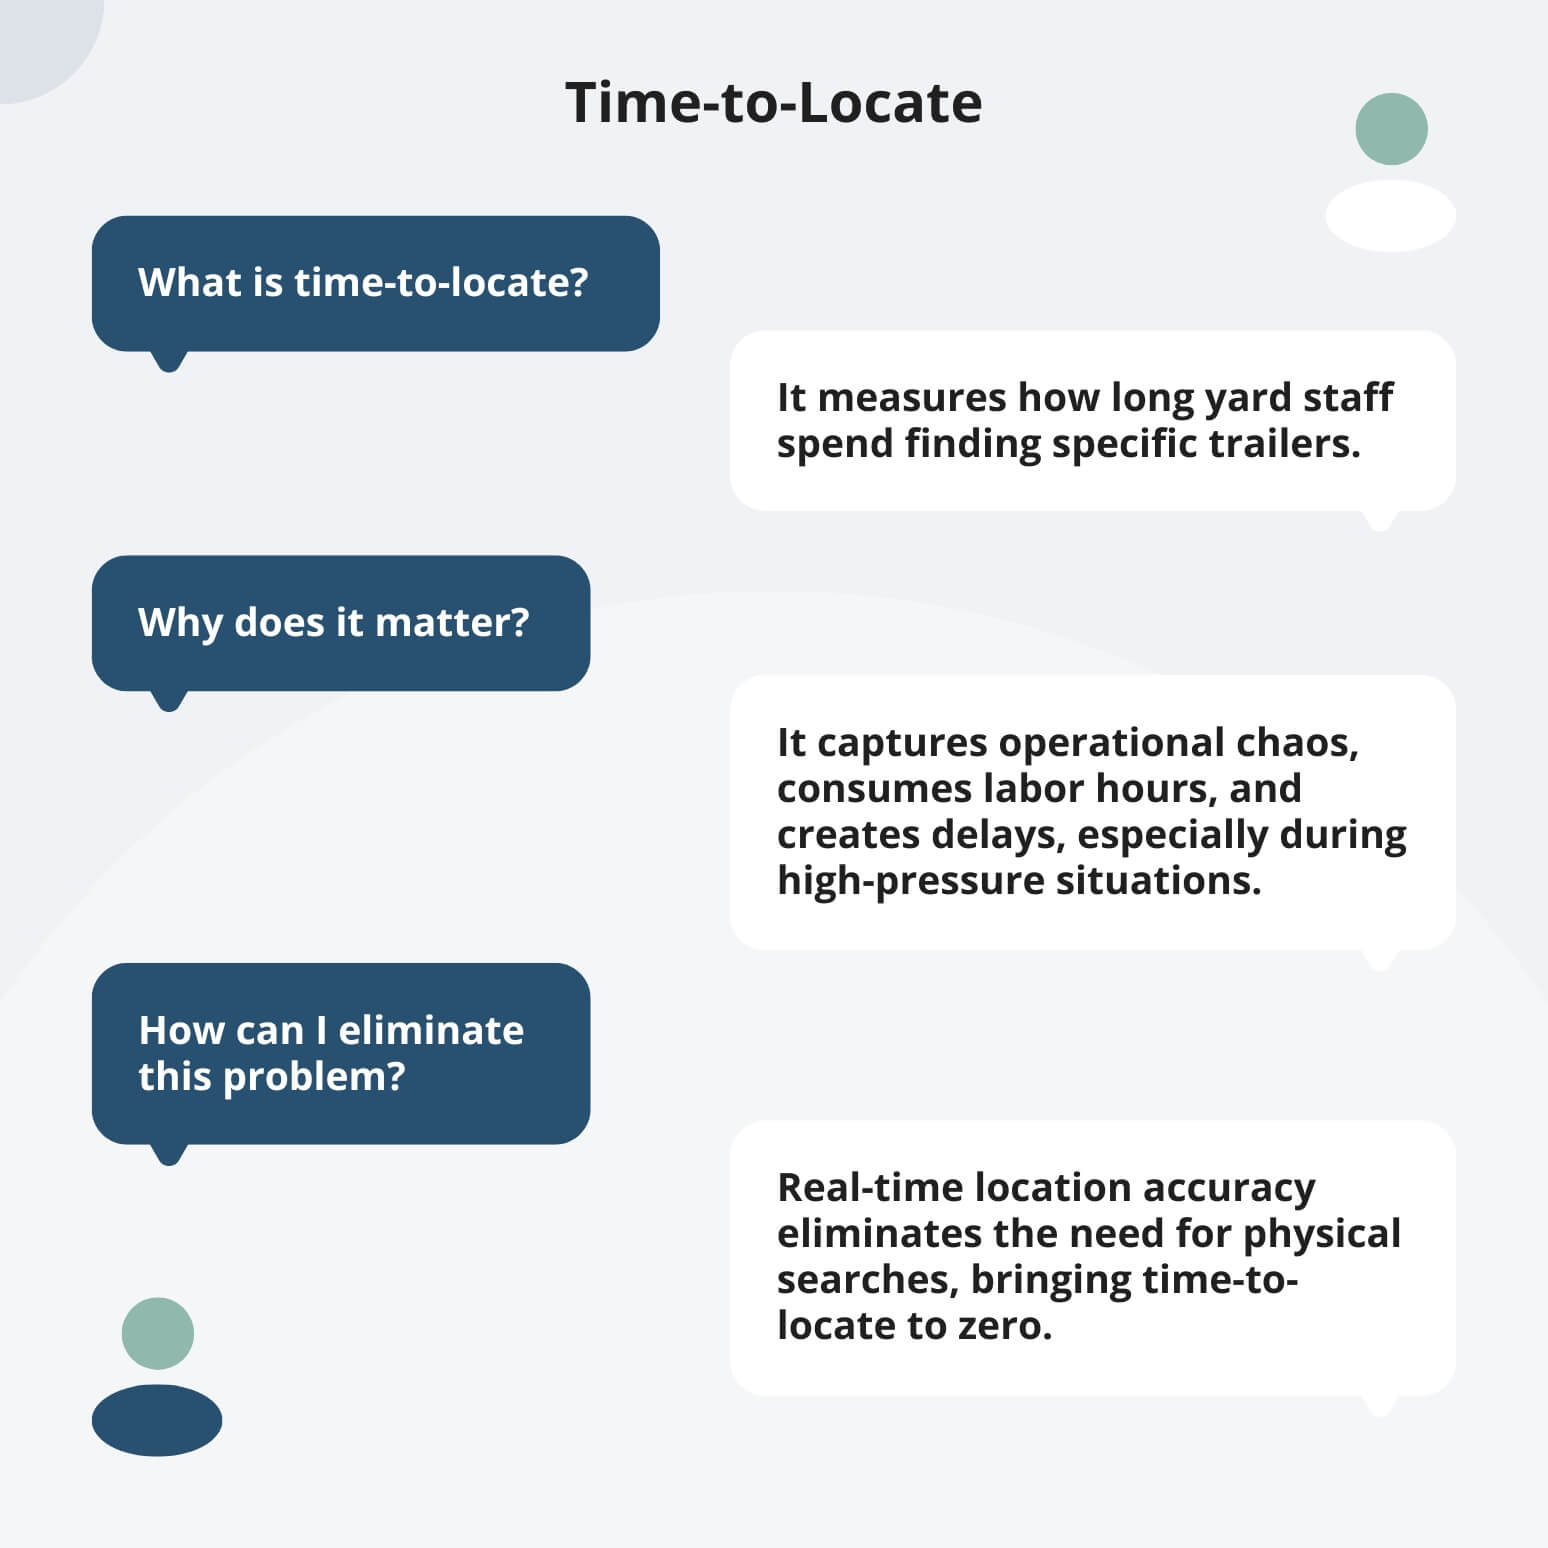
Time-to-locate measures how long yard staff spend finding specific trailers when needed for loading, inspection, or departure. This metric captures operational chaos that doesn't appear on invoices but consumes enormous labor hours and creates cascading delays.
The scenario repeats daily: dock ready, driver ready, but no one knows where the trailer is, so a spotter drives the yard searching while everyone waits. This metric matters most during high-pressure situations—when trailers must leave immediately to hit delivery windows or customers demand shipment status.
That 80% of facility calls asking "where is it?" requires someone to physically look. Real-time location accuracy eliminates this problem—when every trailer's position is known instantly, time-to-locate approaches zero.
Yard Visibility Metric #7: Appointment Adherence Rate
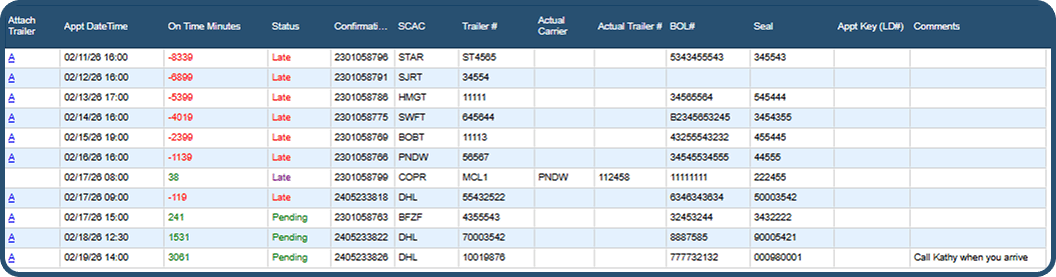
Appointment adherence rate measures the percentage of carriers arriving within their scheduled time windows. Late arrivals disrupt dock schedules and create bottlenecks, but early arrivals can be equally problematic if the facility isn't ready, causing yard congestion and extended dwell times.
When OTIF failures or demurrage charges occur, knowing whether carriers consistently miss appointments helps determine if the problem stems from carrier reliability, unrealistic scheduling, or facility-side delays.
Directors of Transportation schedule appointments based on carrier commitments but rarely have data on actual adherence patterns across carriers or lanes to inform network decisions.
Poor adherence from specific carriers suggests relationship discussions are needed, while poor adherence across many carriers indicates appointment windows or facility processes need adjustment.
Real-time ETA tracking enables proactive dock schedule adjustments when carriers run late rather than reactive scrambling.
Yard Visibility Metric #8: Shunter Productivity
Shunter productivity measures the number of trailer moves—relocations, dock hookups, staging adjustments—completed per shunter per shift.
This utilization metric matters because shunters represent expensive, specialized labor and equipment that often bottleneck yard operations. When shunters follow static task lists or spend time searching for trailers, entire facilities wait for critical movements.
Without real-time visibility into trailer locations and move priorities, shunters waste time figuring out what to do next. Rules-based task assignment transforms productivity by automatically prioritizing urgent moves—OTIF-critical shipments, trailers approaching demurrage, available dock slots—while optimizing routing to minimize empty travel between tasks.
Yard Visibility Metric #9: Demurrage Exposure
Demurrage exposure represents the value of trailers currently in your yard that are approaching or have exceeded free time limits, creating potential or actual financial charges.
This financial risk metric enables proactive intervention rather than reactive payment processing. Tracking exposure requires real-time visibility into exact trailer arrival times, applicable free time limits that vary by carrier and contract, and current locations to assess processing speed.
Directors of Transportation face a critical gap: demurrage charges appear on invoices weeks after occurrence, making prevention impossible without real-time tracking.
Actionable exposure monitoring includes automated alerts at 75% of free time, prioritized dock assignments for high-exposure trailers, and enterprise-wide visibility into total financial risk across all facilities.
Yard Visibility Metric #10: OTIF Risk Indicators
OTIF risk indicators are a set of signals that predict which shipments are likely to miss delivery windows: trailers with inadequate buffer time between current yard status and required departure time, shipments awaiting trailers that haven't arrived, and loads that haven't been assigned to docks with sufficient processing time remaining.
This creates an early warning system that enables prevention rather than explanation. OTIF risk assessment requires connecting yard visibility with customer delivery window data and transportation schedules—data that typically lives in separate systems (YMS, WMS, TMS, customer portals).
Directors of Transportation own OTIF performance but can't improve it without facility-side visibility into which shipments are at risk while there's still time to intervene.
This enables prioritizing at-risk shipments for available dock slots, alerting transportation teams to delivery window conflicts while alternative carriers can be arranged, and notifying customers of potential delays before they occur rather than after.
Improve Yard Visibility With YardView
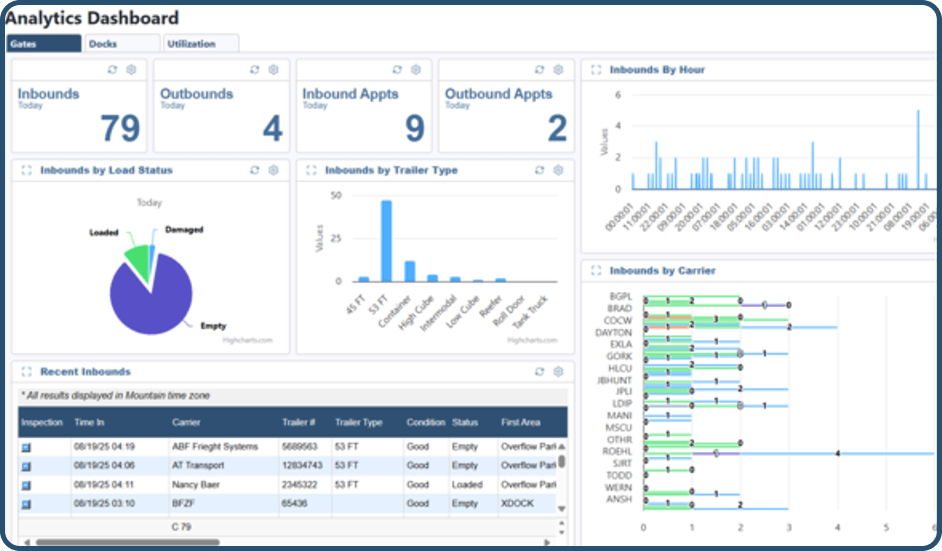
YardView’s platform transforms these critical yard metrics from periodic snapshots into continuous operational intelligence that enables proactive management instead of reactive firefighting.
The platform delivers metric-driven visibility through five integrated capabilities:
- Real-time trailer tracking provides live dwell time, location accuracy, and capacity utilization data without manual audits or yard walks
- Pre-check-in and Fast Pass capabilities generate gate processing time metrics automatically while simultaneously improving performance through digital workflows
- TMS/WMS/ERP integration surfaces OTIF risk and demurrage exposure by connecting yard data with delivery windows and carrier free time limits
- Multi-facility visibility aggregates metrics across your entire network, not just individual yards, enabling enterprise-level optimization
- Rules-based automation turns metrics into action by triggering alerts and task assignments when operational thresholds are breached
Learn more about how YardView eliminates the manual tracking burden while providing transportation and logistics teams with the real-time metrics needed to run efficient, cost-effective yard operations.